

![]()
Economia e Energia – E&E N° 94 Janeiro – Março 2017 – Ano XXI
ISSN 1518-2932
THE USE OF A CONTROL PANEL TO EVALUATE A NUCLEAR UTILITY GLOBAL PERFORMANCE
Carlos Feu Alvim*, Olga Y. Mafra*, Andreza Starling*, Leonardo Paredes*, Joseane Pacheco*, and Leonam L. S. Guimarães**
(*) ECEN Consultoria, (**) Eletrobras Eletronuclear
The operation of a nuclear power plant is facilitated by a control panel, which allows technical system parameters to be monitored. These indicators often use colors to show the state of the several power plant systems.
Based on this kind of panel, an Indicators Panel for monitoring the production, productivity, costs, safety, investments, economical sustainability and market conditions and trends was developed. The Indicators Panel shows the general situation of the company in many ways and is intended to assist the executive management decision making as well as promote a deeper analysis of specific sectors of the company.
Keywords
Control Panel, Indicators, Eletronuclear, Nuclear Energy, Global Performance.
1 Indicators
The benchmarking technique has been used successfully in various economic activities. A comparison of the performance over time requires, on the one hand, the availability of up-to-date indicators of the company studied and, on the other hand, the availability of these indicators for other companies or group of companies that constitute the “mirror” for comparison.
The indicators are a set of technical and economic data allowing the company, in this specific case – Eletrobras Eletronuclear – ETN to monitor its performance in the various areas of its activities and comparing them with those of other companies from same industry sector.
Eletronuclear has the monopoly in exploitation of nuclear power plants in Brazilian Territory. The Indicators system here discussed takes care fundamentally of the energy generation area. It covers Angra1 and Angra2 nuclear power plants performance. The construction of new plants as Angra3 does not integrate the costs and incomes raised.
The Eletronuclear has participated in an international effort to develop indicators such as the Nuclear Economic Performance International System (NEPIS), developed by the IAEA and has been accompanying the Company’s performance for years using the proposed methodology. The ETN also participates in other international comparisons in the areas of: technical performance (WANO and IAEA), operational safety (WANO and IAEA) and has recently joined the Electric Utility Cost Group – EUCG which makes comparisons of economic and operational performance of utilities from the US and some other countries.
The ETN was the Brazilian representative in the International Atomic Energy Agency (IAEA) group that proposed a comprehensive system that provides a general idea of the performance of a generating company or of a specific plant. The IAEA paper TRS437-web, titled Economic Performance Indicators for Nuclear Power Plants, was discussed by representatives of several countries and presented a set of indicators, focused on economic performance, but rather comprehensive. The idea of the IAEA group was to provide a benchmarking between organizations, but there is no previous experience of implementing the system in a company or nuclear power plant. The Eletronuclear, being the pioneer in the implementation of the monitoring of the set of indicators suggested by the IAEA does not have yet the “mirror” that would allow a comparison in all aspects involved.
Some of these indicators, however, are already part of specific international programs from which the Eletronuclear is part; other indicators suggested by the IAEA are published by specialized national or international organizations. There is also information from other companies, released on a regular basis, that allow comparisons for some of the indicators.
The developed system also allows monitoring the behavior of the indicators over time, which permits the evaluation of the current performance of the company based on the historical behavior of these indicators. In this case, the past becomes the “mirror” that makes possible to evaluate the current situation, establish follow-up goals and whenever necessary, adopt corrective measures.
The performance of each indicator is evaluated based on the achievement of the goals established for each of them. The evaluation of the indicators, according to the achievement of the goals, is also presented by colors, informing the last evaluation available.
Control Panel
The Panel assembles the indicators recommended by the IAEA using the results presentation according to the methodology developed by the operating area of the plants. The performance of each indicator is evaluated based on the achievement of the goals established for each of them. The color of the Indicator on the Dashboard indicates the last available valuation for each indicator.
In Figure № 1, it is possible to see the set of indicators with colors that represent the situation in the last evaluated period. The colors vary between green and red, in some cases going through white and yellow. Some indicators in blue are only for follow-up, so they have no limits or goals.
The indicators were grouped into eight sets with a composition similar to that suggested by the IAEA. They correspond to Specific Panels (SP) that compound the main Panel. The Indicators list from the IAEA shows a great concern with the capacity of capital rewards and new investments.
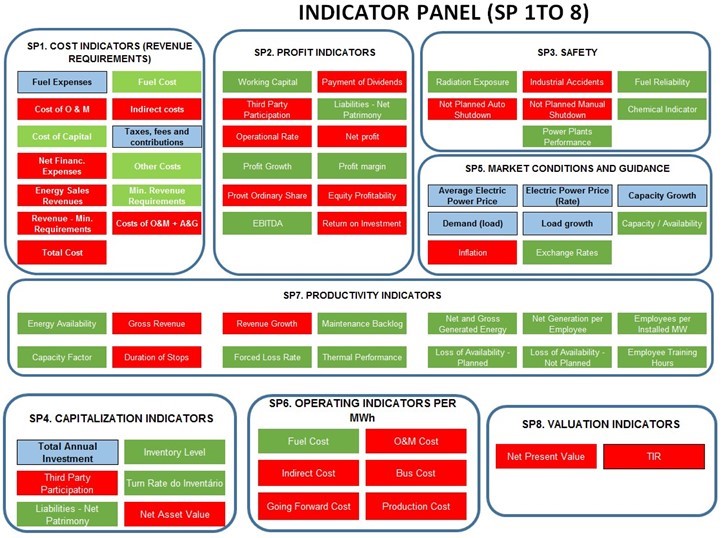
In addition, three other Panels have been created. The International Comparison Panel (PE9), with the purpose of facilitating international comparisons; the Panel of CMDE Indicators (Enterprise Performance Targets – Eletrobras System Indicators) and the Full Panel of Technical Indicators. The Figure №1 shows the Indicators Panel with the 68 indicators compiled, two of which are duplicate, because they are part of more than one Specific Panel.
The Specific Panels (SP) that compose the main Panel are listed below:
- SP 1. Cost Indicators (Revenue Requirements);
- SP 2. Profitability Indicators;
- SP 3. Safety Indicators;
- SP 4. Capitalization Indicators;
- SP 5. Market Conditions and Orientation;
- SP 6. Operating Indicators per MWh;
- SP 7. Productivity Indicators;
- SP 8. Valuation Indicators.
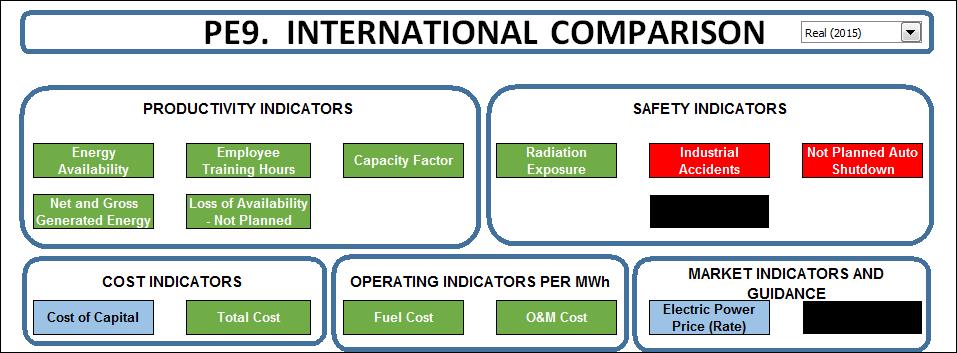
In addition, the three new specific panels (SP 9., SP 10. and SP 11.) created to meet the project needs:
- SP 9. International Comparison;
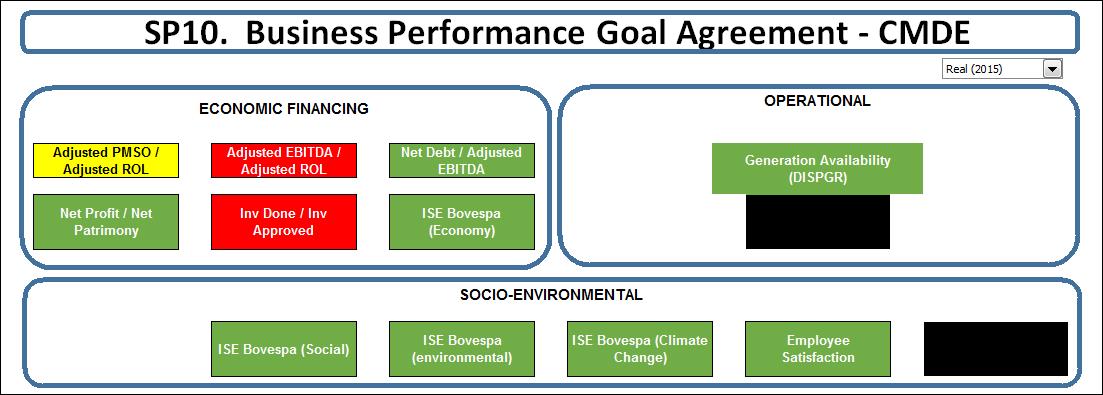
- SP 10. CMDE Indicators (Enterprise Performance Targets – Eletrobras System Indicators);
- SP 11. Technical Indicators Panel.
The Figure № 2 presents SP 9, which allows direct comparison with international companies, “mirrors” available for thirteen indicators and Figure № 3 presents SP 10, with the Eletrobras System Indicators – CMDE.
2 Methodology
The Panel compiles all the indicators chosen for follow-up, their specificities, limitations and historical data.
The data collection is gathered together in the Panel from 2008 to 2015, in the shortest period available: monthly, quarterly or annually. These data allow a historical monitoring, which assists in analyzing the behavior of the indicators.
The comparison with data from the past or from other countries implies, for monetary data, its updating and conversion. The general rule adopted by the Panel is the correction of inflation with local general indexes and the conversion into another currency (in general dollar) at the exchange rate of one year (average of the previous year, average of the current year or index accumulated until June of the current year).
The “Equilibrium Exchange” which considers the historical behavior of the inflation-adjusted exchange rate in the two countries is also used.
In the Panel’s case, monetary data can currently be expressed in current Real, Real of 2015, Dollar of 2015, Dollar of 2016 or Balancing Dollar. The correction for Real of 2015 is made using the IGP-DI. The correction for the Dollar of 2015 is made by multiplying the value in Real of 2015 by the average rate of the Commercial Exchange for Sale for that year. It is also possible to use Real for the current year (in this case, 2016). For that, the conversion is made from the average value of the currency of the previous year (in this case, 2015), and the correction is made for the current year using the IGP-DI for Brazil.
The correction using the Equilibrium Exchange is similarly made by multiplying the average dollar value of 2015 by the appropriate factor, based on the IPC indexes for the US and IGP-DI for Brazil.
It should be noted that the targets for each year that involve monetary values are established in nominal Real which means that the goal in Real value (corrected for inflation) is decreasing in constant currency (Real or Dollar).
The process of data feeding is still being systematized, which results in different dates and reference documents. The input data are organized by periodicity (month, trimester and year) and collected directly from data basis and reference documents, mostly provided by Eletronuclear Company. Some input data come from external sources or result from data composition by specific explicit formula.
Monthly and quarterly data are usually revised when presented on a consolidated annual basis.
The Company already has a monitoring system with indicators in the areas of Productivity and Safety that were incorporated to the system using the same goals they use.
It was also incorporated to the Panel data from Enterprise Performance Targets – Eletrobras System Indicators (CMDE) which is a system used by the Holding Eletrobras Company for follow-up. The data from Eletronuclear’s Budget and Costs Monitoring System are also used, the same as its Annual and Quarterly Balance.
The evaluation of Operation and Maintenance costs used the Eletronuclear system from the NEPIS database, adapted to make the data compatible with the Annual Balance. Indeed, focusing on the international comparison, the NEPIS base does not incorporate some local costs such as taxes, financial costs and so on.
Some data are compiled separately for Angra 1 and Angra 2, but the majority can be consolidated for the Almirante Álvaro Alberto Nuclear Power Plant (CNAAA) using some specified criteria for each consolidation case. In some cases, can be sum (for example, the energy produced), in others the weighted average using the power of each plant. There are, however, some cases where such consolidation does not make sense.
The data provided separately for each plant are mainly technical. The economic and financial data are, in most cases, already consolidated for Angra 1 + 2. Data for Angra 3 are generally excluded. There are, however, cases in which only the consolidated value is available that is, including Angra 3.
Some available consolidated economic data are computed in the NEPIS system, and the values among the plants are apportioned in proportion to their power. Others have their own costing system, which allows them to specify the cost associated with each plant. In this paper, the cost share is consolidated.
The consolidated annual data from Control Panel resulted in a report entitled Indicator Copybook, which compiles all indicators chosen for follow-up, their specificities, limitations and analysis.
This Report complements the Panel’s work by presenting a printed picture of the main data that are essentially and that are available on the Panel, that is, those recommended by the IAEA, in addition to the other complementary indicators that are considered important by the ETN.
The Indicators Copybook also aims at detailing and clarifying the methodology used for the economic and technical indicators calculation, compiling all indicators used as a subsidy for comparisons with Mirror Companies. Additionally, the analysis of these same indicators seeks to show to the managers and decision makers of the nuclear sector the situation of nuclear generation in Brazil comparing to the world’s nuclear power plants and the competitive conditions of nuclear energy in the coming decades.
Both the Panel and the Indicator Copybook present the results in nine groups defined by the Specific Panels also called specific panels, which will be described in the following paragraphs:
Specific Panel 1: Cost Indicators (Revenue Requirements). This Specific Panel tracks Costs and confronts them with Revenues. It has been adapted to provide the updated data that were the subject of ECEN Report № 3 and which serve as a basis for comparison with other countries. This group of indicators corresponds to the IAEA indicator group entitled T8: Measures of the Cost of Service (Revenue Requirements).
Specific Panel 2: Indicators of Profitability (Profit remaining after payment of commercial expenses). Traditionally, in a typical regulated power plant, profit and loss statement of income and financial measures are prepared and evaluated at the operational level of the company or holding company and do not include detailed information at the level of the nuclear power plant. These indicators are of interest to shareholders. This group of indicators corresponds to the IAEA indicator group titled T2: Measures of Profitability.
Specific Panel 3: Security Indicators. It deals with the evaluation of safety and reliability of the plant as ionizing radiation doses, performance of the safety system, performance of chemical indicators etc. Some indicators in this group are not from the IAEA as some from WANO. Most of them were already in use by ETN. This group of indicators corresponds to the IAEA group titled T3: Measures of Safety.
Specific Panel 4: Capitalization Indicators. This Panel gives an overview of how the company uses external and own resources to capitalize. It deals with the total value of the material and inventory of the nuclear plant, the investments made in equipment and facilities, etc. Nuclear Fuel is not included, being a separate item from the Balance Sheet. This group of indicators corresponds to the IAEA group entitled T6: Measures of Capitalization.
Specific Panel 5: Market Condition and Orientation. Economic performance indicators can be separated into two broad areas – the plant indicators and market indicators. The plant indicators are those that are typically under the control of nuclear power plant management. This Specific Panel gather the market indicators that can have a significant impact on the financial success of a nuclear unit, but which are typically beyond the control of plant managers and operators.
The distinction between economic measures at plant and market levels is very important to emphasize to nuclear plant managers the deep relationship between market conditions and the economic performance of nuclear power plants, a relationship that in the past was rarely considered. This group of indicators corresponds to the IAEA group entitled T7: Measures of Market Condition and Orientation.
Specific Panel 6: Operating Costs per MWh. This Specific Panel demonstrates operating costs per MWh, facilitating comparison with external companies and internal energy cost analysis. Some of these indicators are already in other Specific Panels, but in this one they are in the cost/MWh unit to facilitate comparison with values of other countries and organizations and cost of electricity from different energy sources. This group of indicators corresponds to the IAEA group entitled T5.
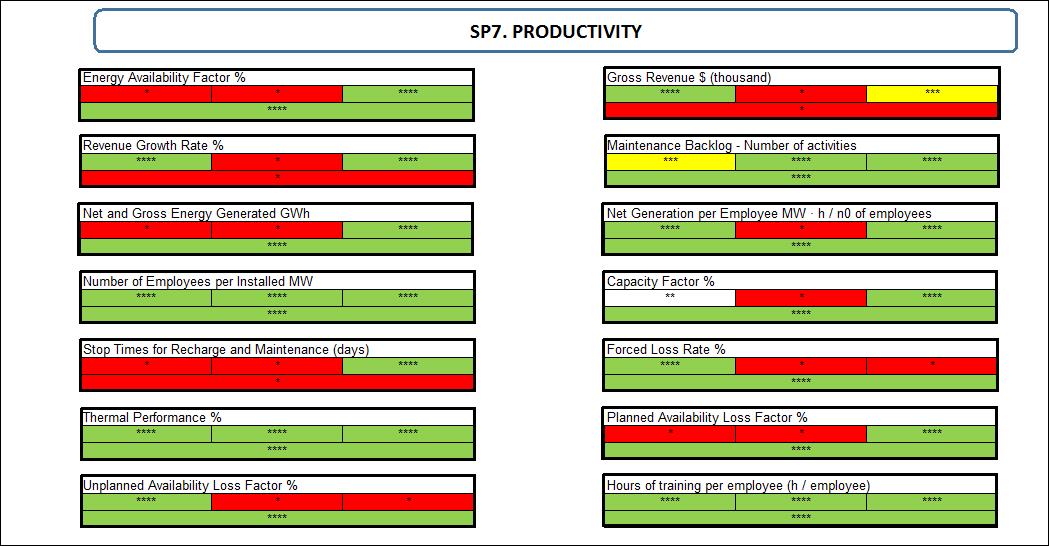
Specific Panel 7: Productivity Indicators. The Panel monitors how the company’s productivity is and if it could be producing/profiting from more efficient resource management. Contains Indicators linked to the generation of energy, availability, capacity factor, availability losses, fuel recharging outages and their duration, backlog etc. These indicators were already used by Eletronuclear in its reports. Eletronuclear’s calculation methodology was largely defined from the WANO description, according to the WANO Performance Indicators – 2013 document. This group of indicators corresponds to the IAEA group entitled T1: Measures of Productivity.
An example of Specific Panel is presented in the Figure № 4. For each indicator, it is presented the result for the last four measurements. The colors change from green to red passing through yellow and white if a tolerance value is established.
Specific Panel 8: Valuation. Indicators that involve Valuation provide information on the adequacy of the tariff for the remuneration of the assets and for the expected expenses and revenues. This group of indicators corresponds to the IAEA group entitled T4: Measures of Valuation.
Specific Panel 9: International Comparison. This Panel has four specific panels containing indicators already organized to make international comparisons. The Specific Panels are: Productivity Indicators, Operating Indicators per MWh, Safety Indicators and Cost Indicators. The goal of this Panel is to facilitate international comparisons. The indicators that make it up are indicators in the Scoreboard that have data available for comparison in the IAEA, WANO or EUCG.
As stated earlier, each indicator has its own methodology used for its calculation. Therefore, it will be detailed the method of calculating the indicator (ID7.8), Factor of Capacity, of the Specific Panel Productivity in order to exemplify one calculation using the methodology mentioned.
This Indicator represents the percentage of net production capacity that was actually produced. The same was chosen as an example because it synthesizes the operation of the central plant or the individual one. This indicator is defined as the ratio of the energy that a power reactor unit produced in a given period divided by the energy it would have produced in its reference power capacity in the same period. Its coverage is global (central) and per plant and its calculation formula given by the ratio [(Generated Energy) / (Reference Energy)] x100, its unit being thus in percentage (%) with two decimal places. The established goal is 88.7% per month and the margin of tolerance is 5%. It is shown in Figure № 5.

3 Results
The presentation of the indicator results follows a standard visualization for the user of the Panel. In some cases where exists the possibility, the results presentation can be shown by plant or by the nuclear power station, even though some graphical elements are common independently of the selected indicator. They are:
- A graph showing the historical annual results. This tool is very important for the users to have a broad knowledge of the historical values of the indicator under research and permits to make an evaluation over a long period of time about the performance of their values.
- A graph showing the values of the indicator searched in accordance with its specific periodicity that can be monthly, quarterly or annually. Thus, it is important to note that the stipulated target for the indicator is shown in the Values Chart, facilitating the operator to identify the periods in which the results were above or below the goals set by the company.
- The indicator warning light is a tool inspired in the control panels of the reactors and which seeks to give the operator a visual signal of easy interpretation. This tool is a form of direct presentation of the indicators performance since it reflects the fulfillment of the established goal for each of them. The indicator color signed in the Panel informs the last evaluations available, however, the Specific Panels allow the visually monitoring of the last four information available for each indicator. The colors remain between green and red and in some cases can be white or yellow. It can be observed that some indicators are shown in the blue color. This means that these indicators are only for monitoring and don’t have limits or goals.
- The Polarity of the Indicator. This visual element that can be seen in the results presentation is represented by an arrow, indicating the direction of optimization of the result. As an example, an upward-pointing arrow represents that the higher the indicator values, the better their performance; while the down direction proposes that the smaller the values the better is the situation.
- Indicator Calculation Formula. The formula used to calculate the result values is displayed on the specific presentation screen of the results. To exemplify let´s use the indicator 9.1 (Energy Availability Factor) where its formula (Installed Production Capacity-Unplanned Losses-Gross Planned Losses-Losses by Extended Stops)/Installed production capacity x 100), is shown on the screen above the warning light sign.
As an example, it is presented the Specific Panel 9 – International Panel. This group of indicators has already been approached in other Panels and was created aiming at facilitating the international comparisons. A small part of the table for the International Comparison Indicators can be seen in Figure № 6.

Figure 6: Part of the Table with information of the Specific Panel 9
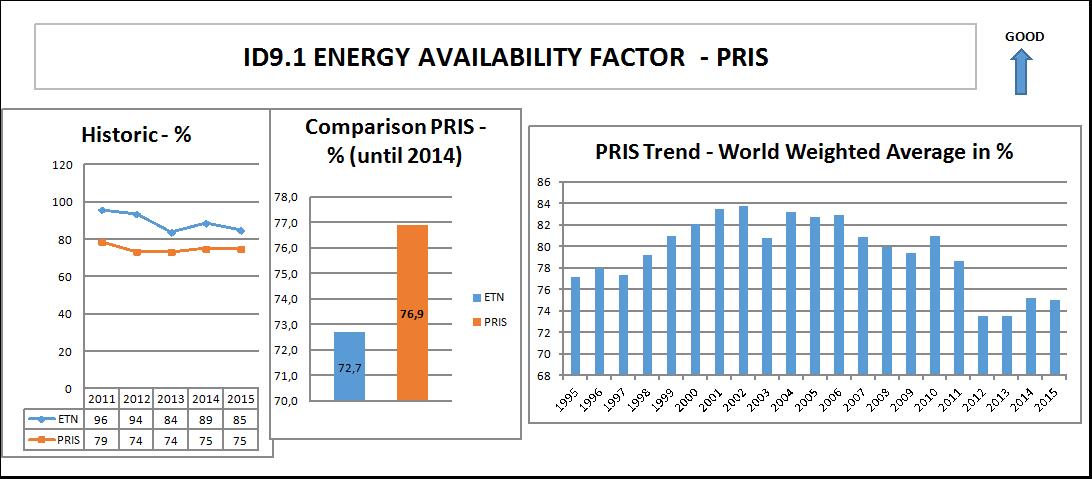
As an example, consulting the Page of the panel corresponding to the item ID9.1 – Energy Availability Factors (Figure № 7a) it is possible to see the historical values from ETN (consolidated for Angra1 and Angra2) and values from PRIS from 2011 to 2015.
The performance from ETN is very good when compared with PRIS data for these years. It is possible also to see the data since the Angra 1 plant started to produce energy. Of course, as at the beginning of the operation a lot of adjustments had to be made, the data from PRIS are better than the ones from CNAAA (Central Nuclear Almirante Alvaro Alberto), but not so much (72.7 for ETN to 76.9 for PRIS). The next figure shows the world average data from PRIS from 1995 to 2015.
In the tables from Figure № 7b below it is possible to see the data from ETN and PRIS used to perform the graphs.

Using the panel all this information (data and graphs) are in the same page and there are points to be clicked that permits one to return to the Panel Control, to the Specific Panel in use to see other indicators and to see the data for each of the units and not the consolidated.
In the observed period from 2011 to 2015 the ETN performance was above the world average value. From the data shown the performance from the CNAAA was higher, presenting in average the value 90% when the world average was 75%. The performance of ETN in the period was 15 percentage points above the results of the average of the reactors included in the system PRIS/IAEA (practically all).
The world results however had, from 2011 on, a reduction effect of the shutdown of energy production from Japanese reactors, after the Fukushima accident. That’s why the international reference was taken from years before de accident (80.8 %). Even though, the ETN result is superior in all the years shown in the historic graph.
In the graph PRIS Trend – World Weighted Average in % it can be seen a drop in recent years, that is partially due to the containment of demand, but one should also consider the Fukushima effect, that practically paralyzed the Japanese nuclear power plants.
4 Conclusion
This paper deals with the use of indicators to analyze the current situation of a company. In the particular case, the work was done for Eletronuclear, since the indicators, goals and limits used were supplied by ETN direct or indirectly.
The managing of a company is essential not only for its survival, but mainly for advancing its ability to solve internal problems, increasing its capacity to respond to market demands and changes, optimize its efficiency and agility. It is also important to facilitate its fitness and implementation of its strategies, besides to improve its capacity to offer new products and services. The use of tools that assist the manager in the coordination and management of a company, whether in specialized technical areas or in the scope of the market becomes a very important instrument of assistance.
The Control Panel comes precisely with the objective of compiling the technical and strategic data of the Eletronuclear, presenting them in an easy-to-use platform and using a series of graphical and financial tools, in order to assist the manager in the decision-making. It is important to highlight that in addition to compiling and presenting the data, the Panel has the ability to compare several parameters of the nuclear area with those of “mirror” companies, thus permitting clear and easily to compare the efficiency of the Company with others of the same industrial sector. In this way, the effectiveness of the Control Panel is visible as a managerial tool and can be used by any enterprise, public or private, and even by entrepreneurs who want to improve and optimize their management through the use of their indicators and goals.
The annual indicators can be used to make an analysis of Eletronuclear’s performance and to guide possible corrections in the policy of the company and of the sector.
A preliminary analysis of the ETN performance based on the number of red indicators was performed. The economic situation was stressed by the indicators. For Productivity and Safety, the performance of CNAAA was still good compared with international results but not so good in 2015. It must be remarked that as compared with international nuclear utilities the cost of CNAAA electricity was competitive but the annual tariff fixed by ANEEL was not enough to pay the production costs.
References
INTERNATIONAL ATOMIC ENERGY AGENCY (2006). Technical Reports Series № 437 – Economic Performance Indicators for Nuclear Power Plants.
INTERNATIONAL ATOMIC ENERGY AGENCY (2002). Technical Repots Series № 406 – System to Enhance Nuclear Power plant Competitiveness
ECEN CONSULTORIA (2016). Report “Caderno de Indicadores 2016 da Eletronuclear. Contrato № GCNA – 4500174757
ECEN CONSULTORIA (2016). Report “Eletronuclear: Indicadores de Desempenho” – Resumo Executivo. Contrato № GCNA – 450017475